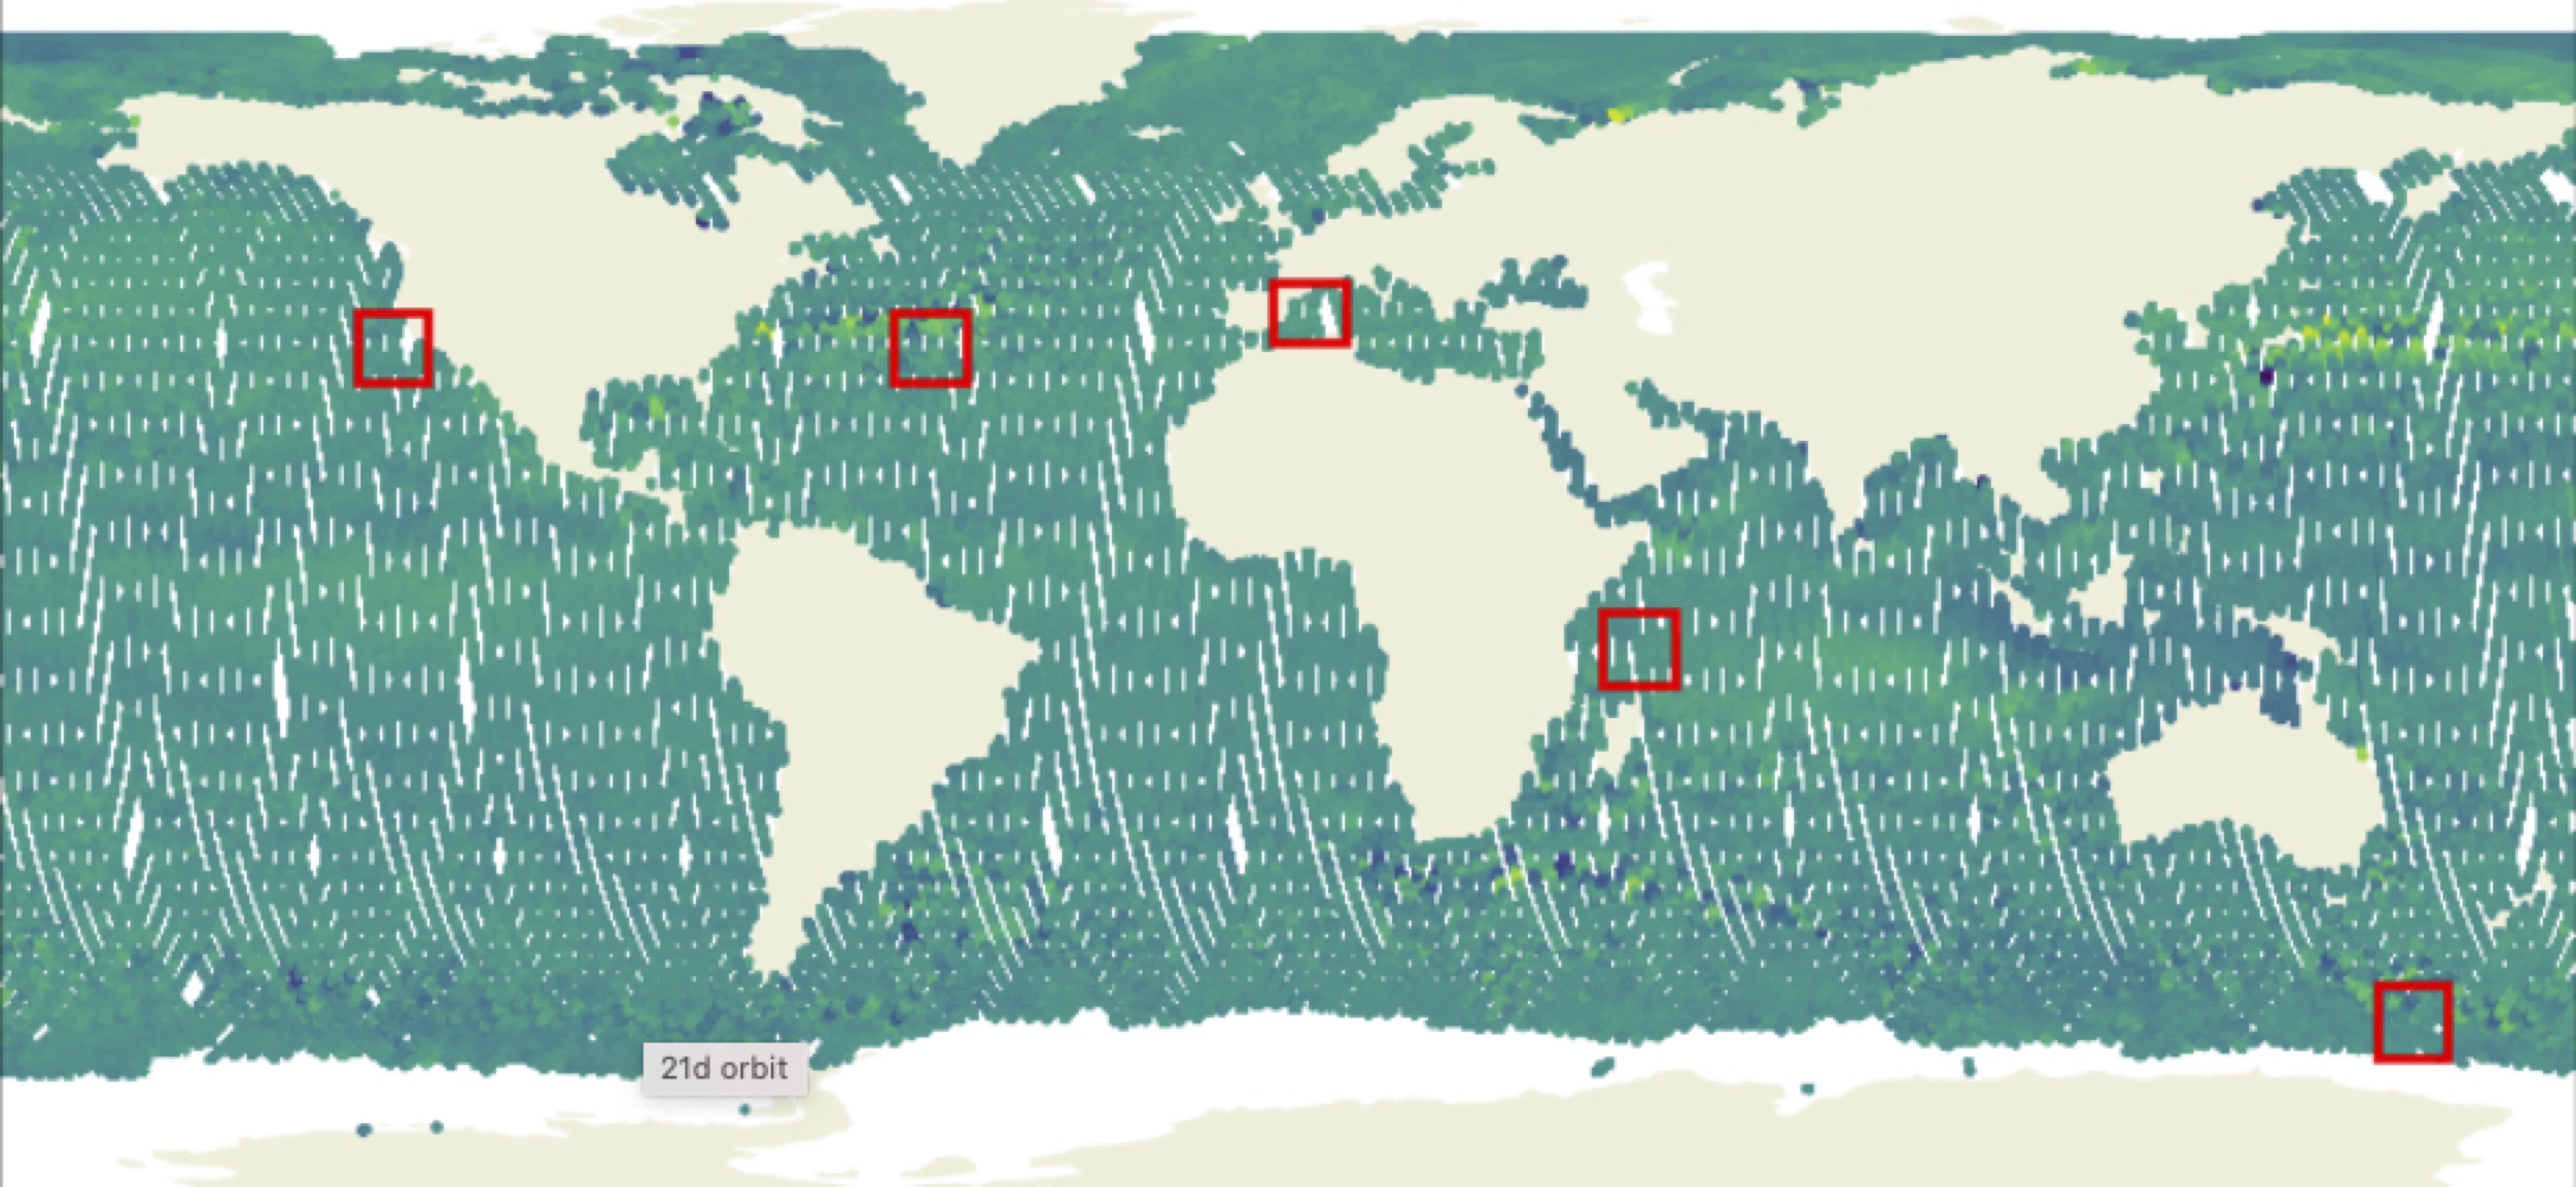
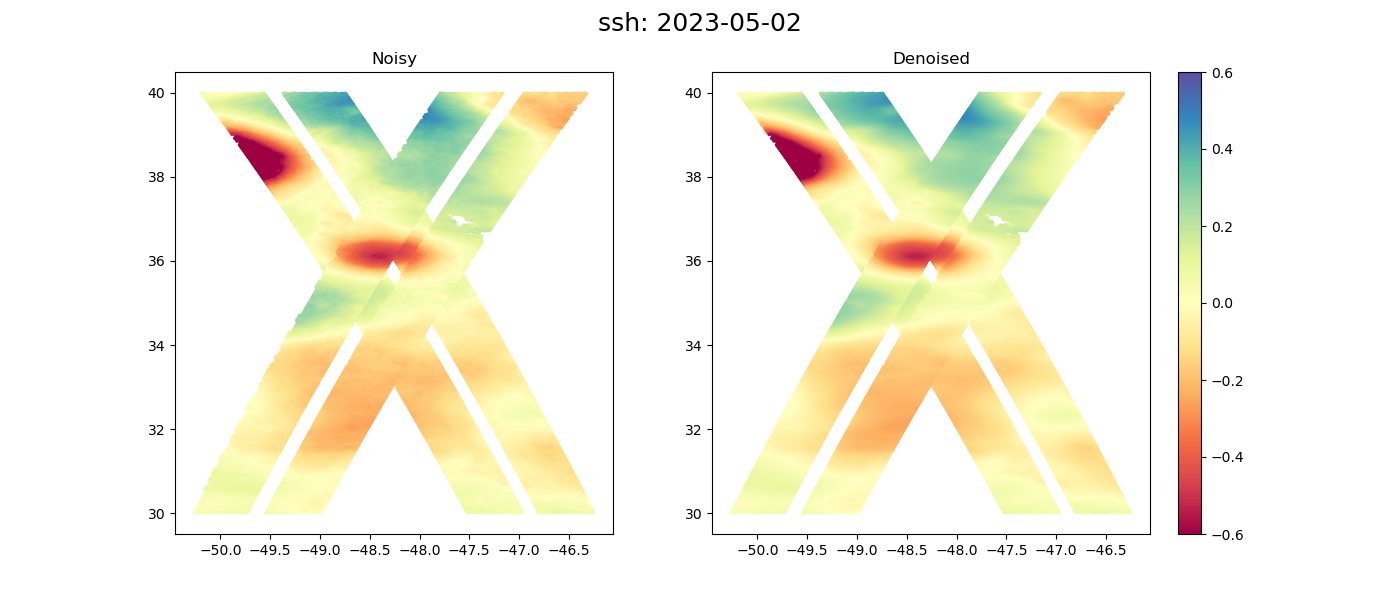
Gulf Stream region#
▶️ Snapshots
SSH |
|---|
|
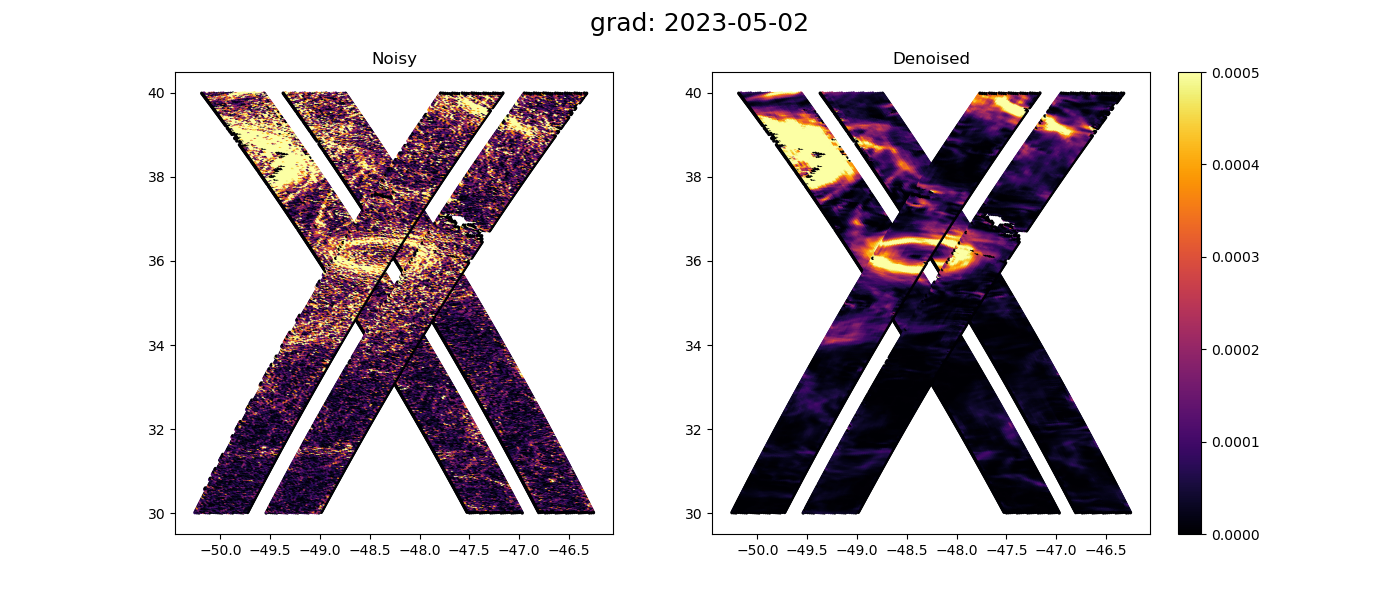
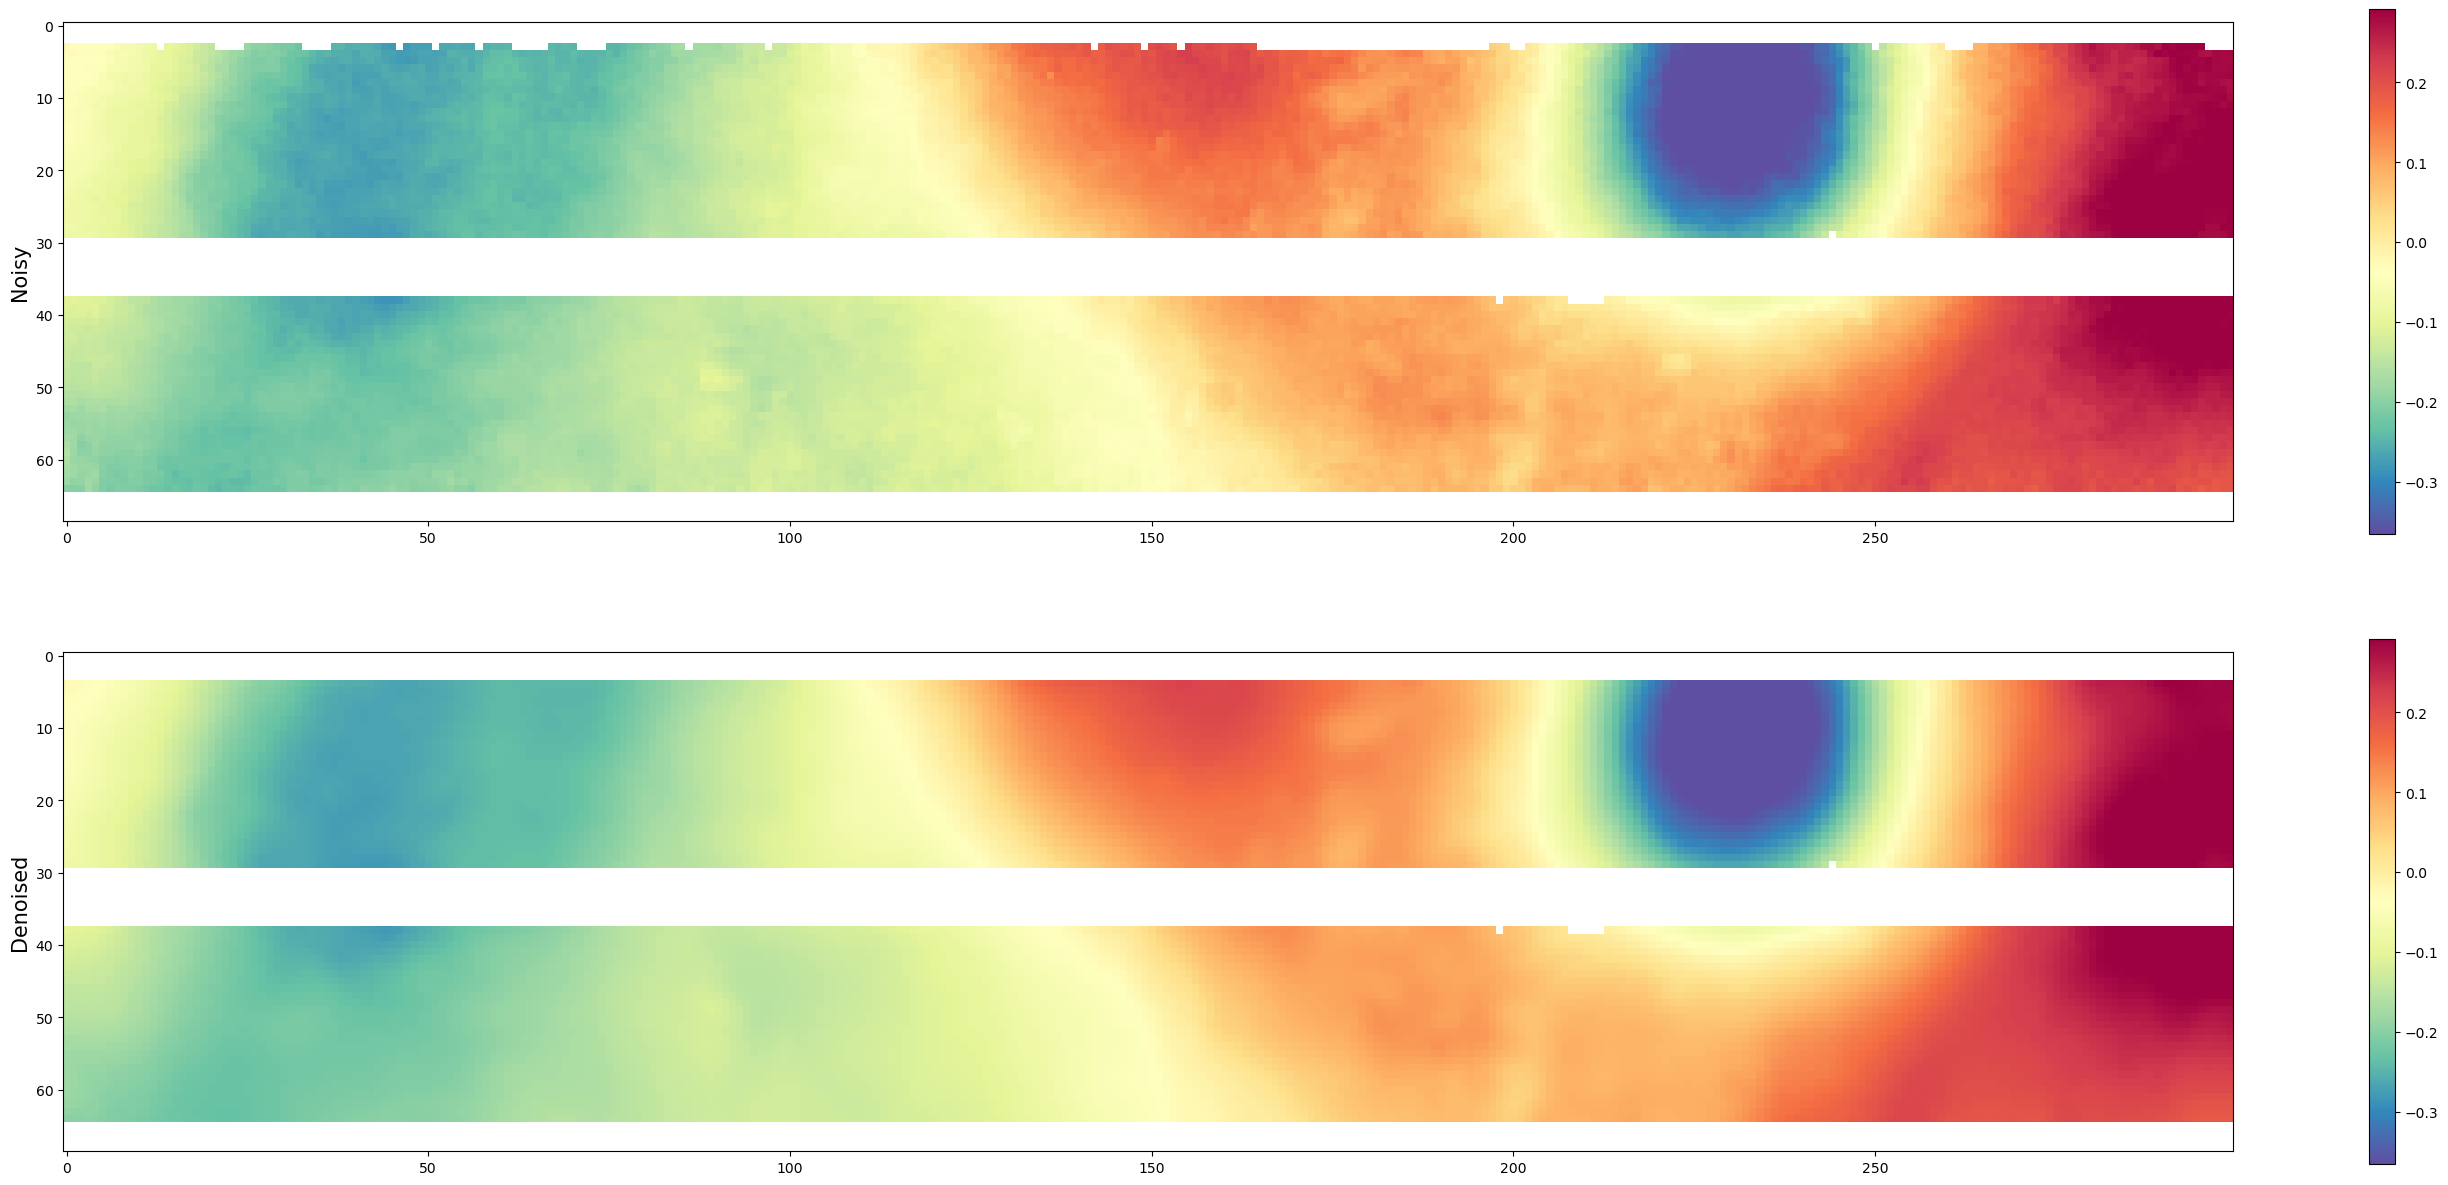
Gradients of SSH |
|---|
|
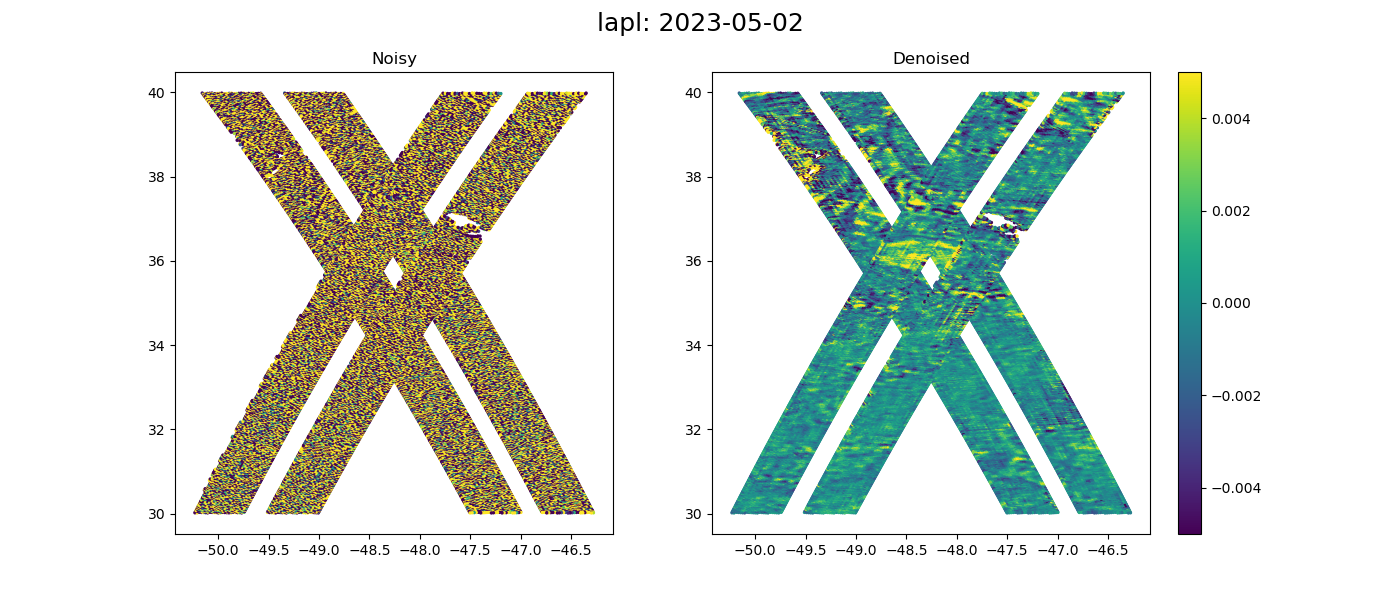
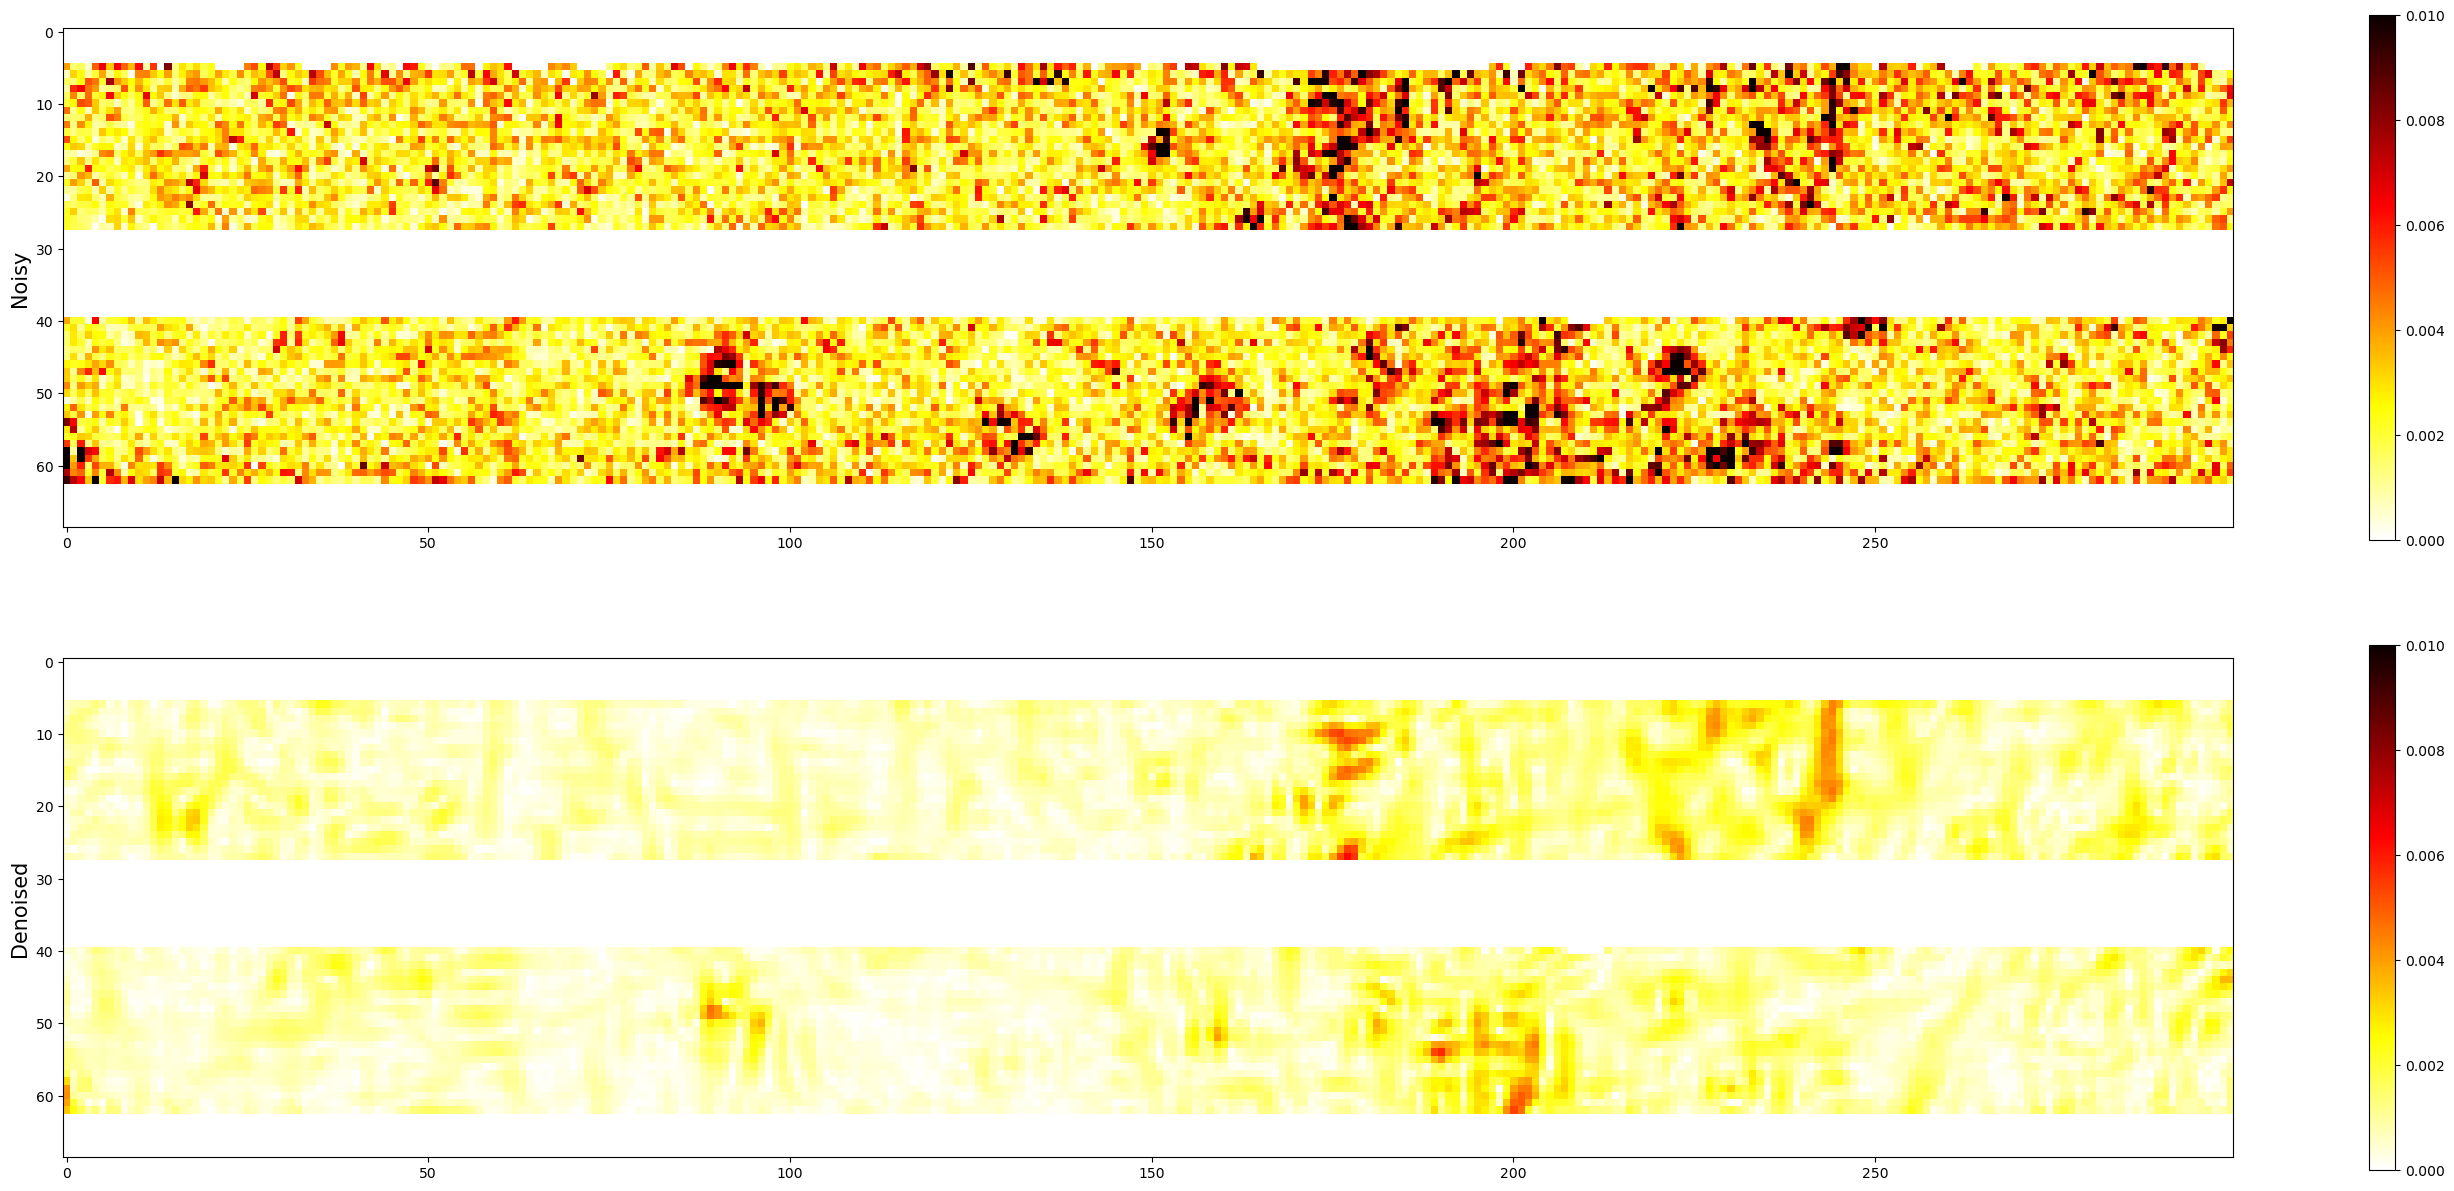
Laplacian of SSH |
|---|
|
▶️ Movies
SSH
Gradients of SSH
Laplacian of SSH
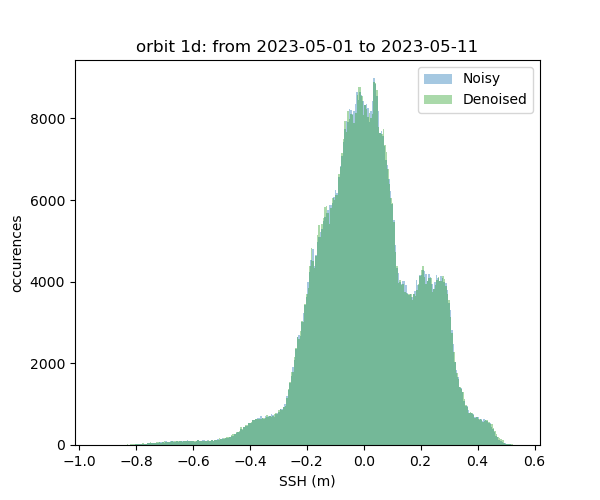
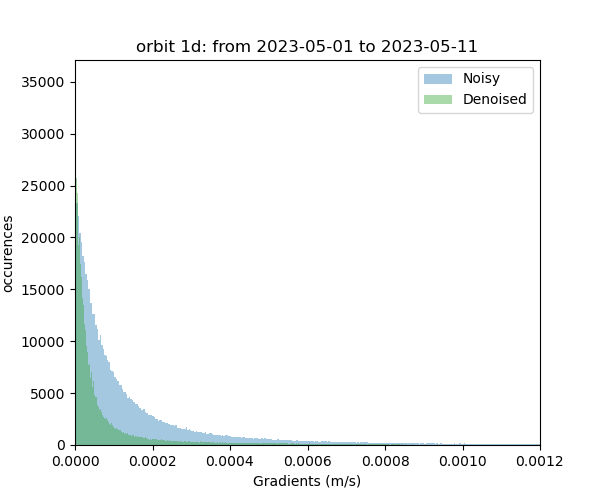
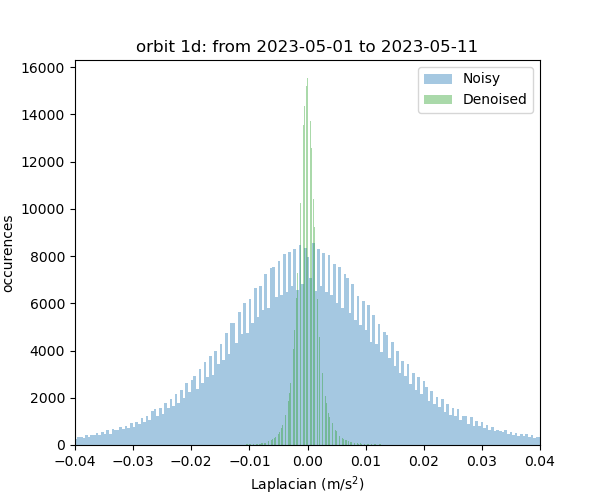
▶️ Physical pdf
SSH |
Gradients of SSH |
Laplacian of SSH |
|---|---|---|
|
|
|
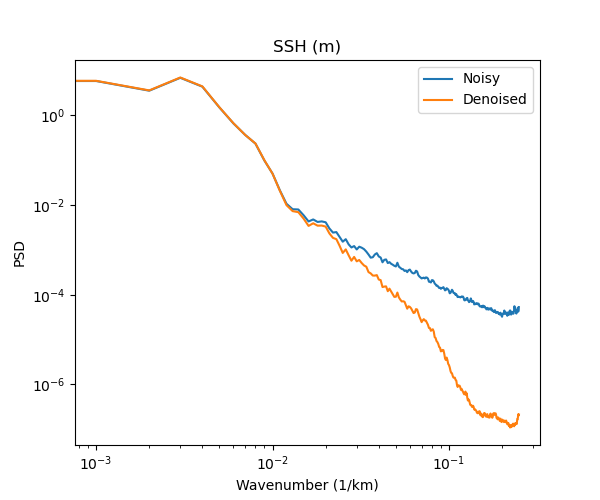
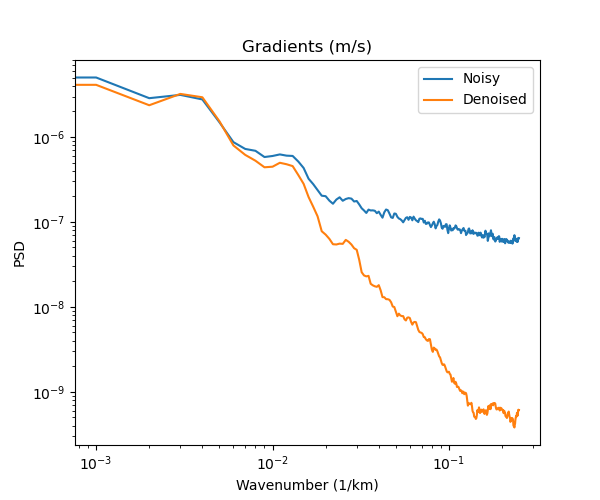
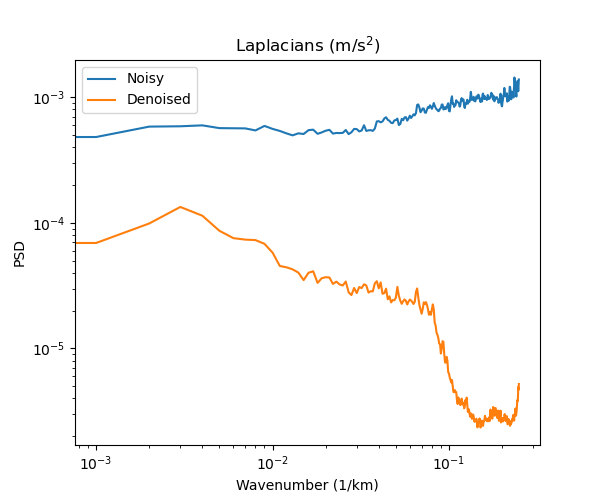
▶️ Power Spectrum Density
SSH |
Gradients of SSH |
Laplacian of SSH |
|---|---|---|
|
|
|
▶️ Roberts discontinuities
SSH |
Gradients of SSH |
|---|---|
|
|
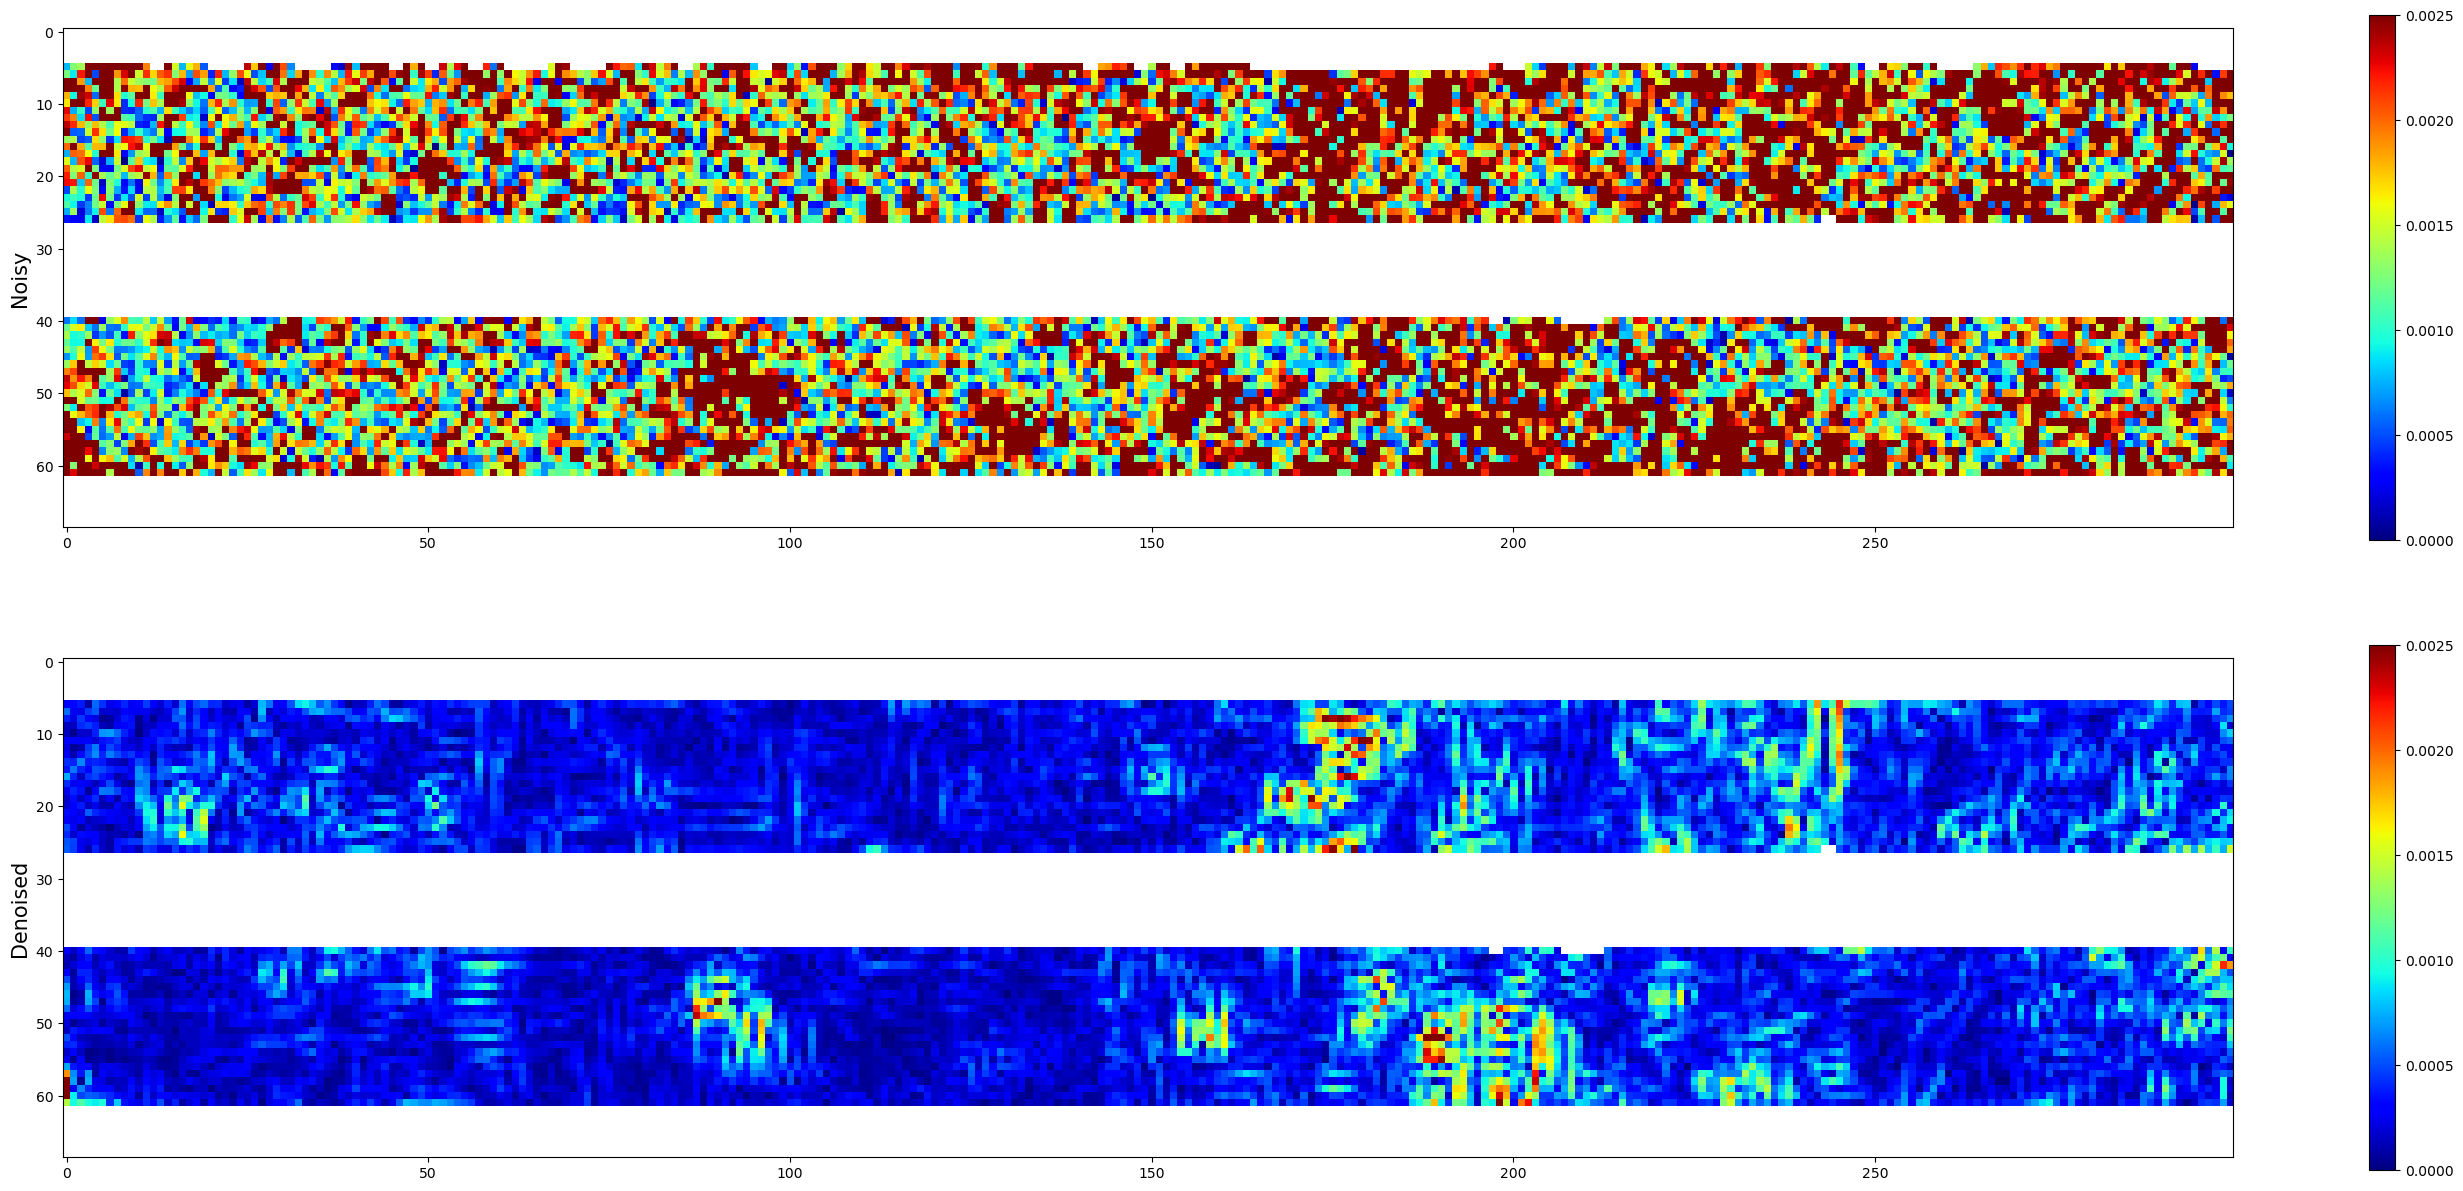
Roberts discontinuities |
Masked Roberts discontinuities |
|
|
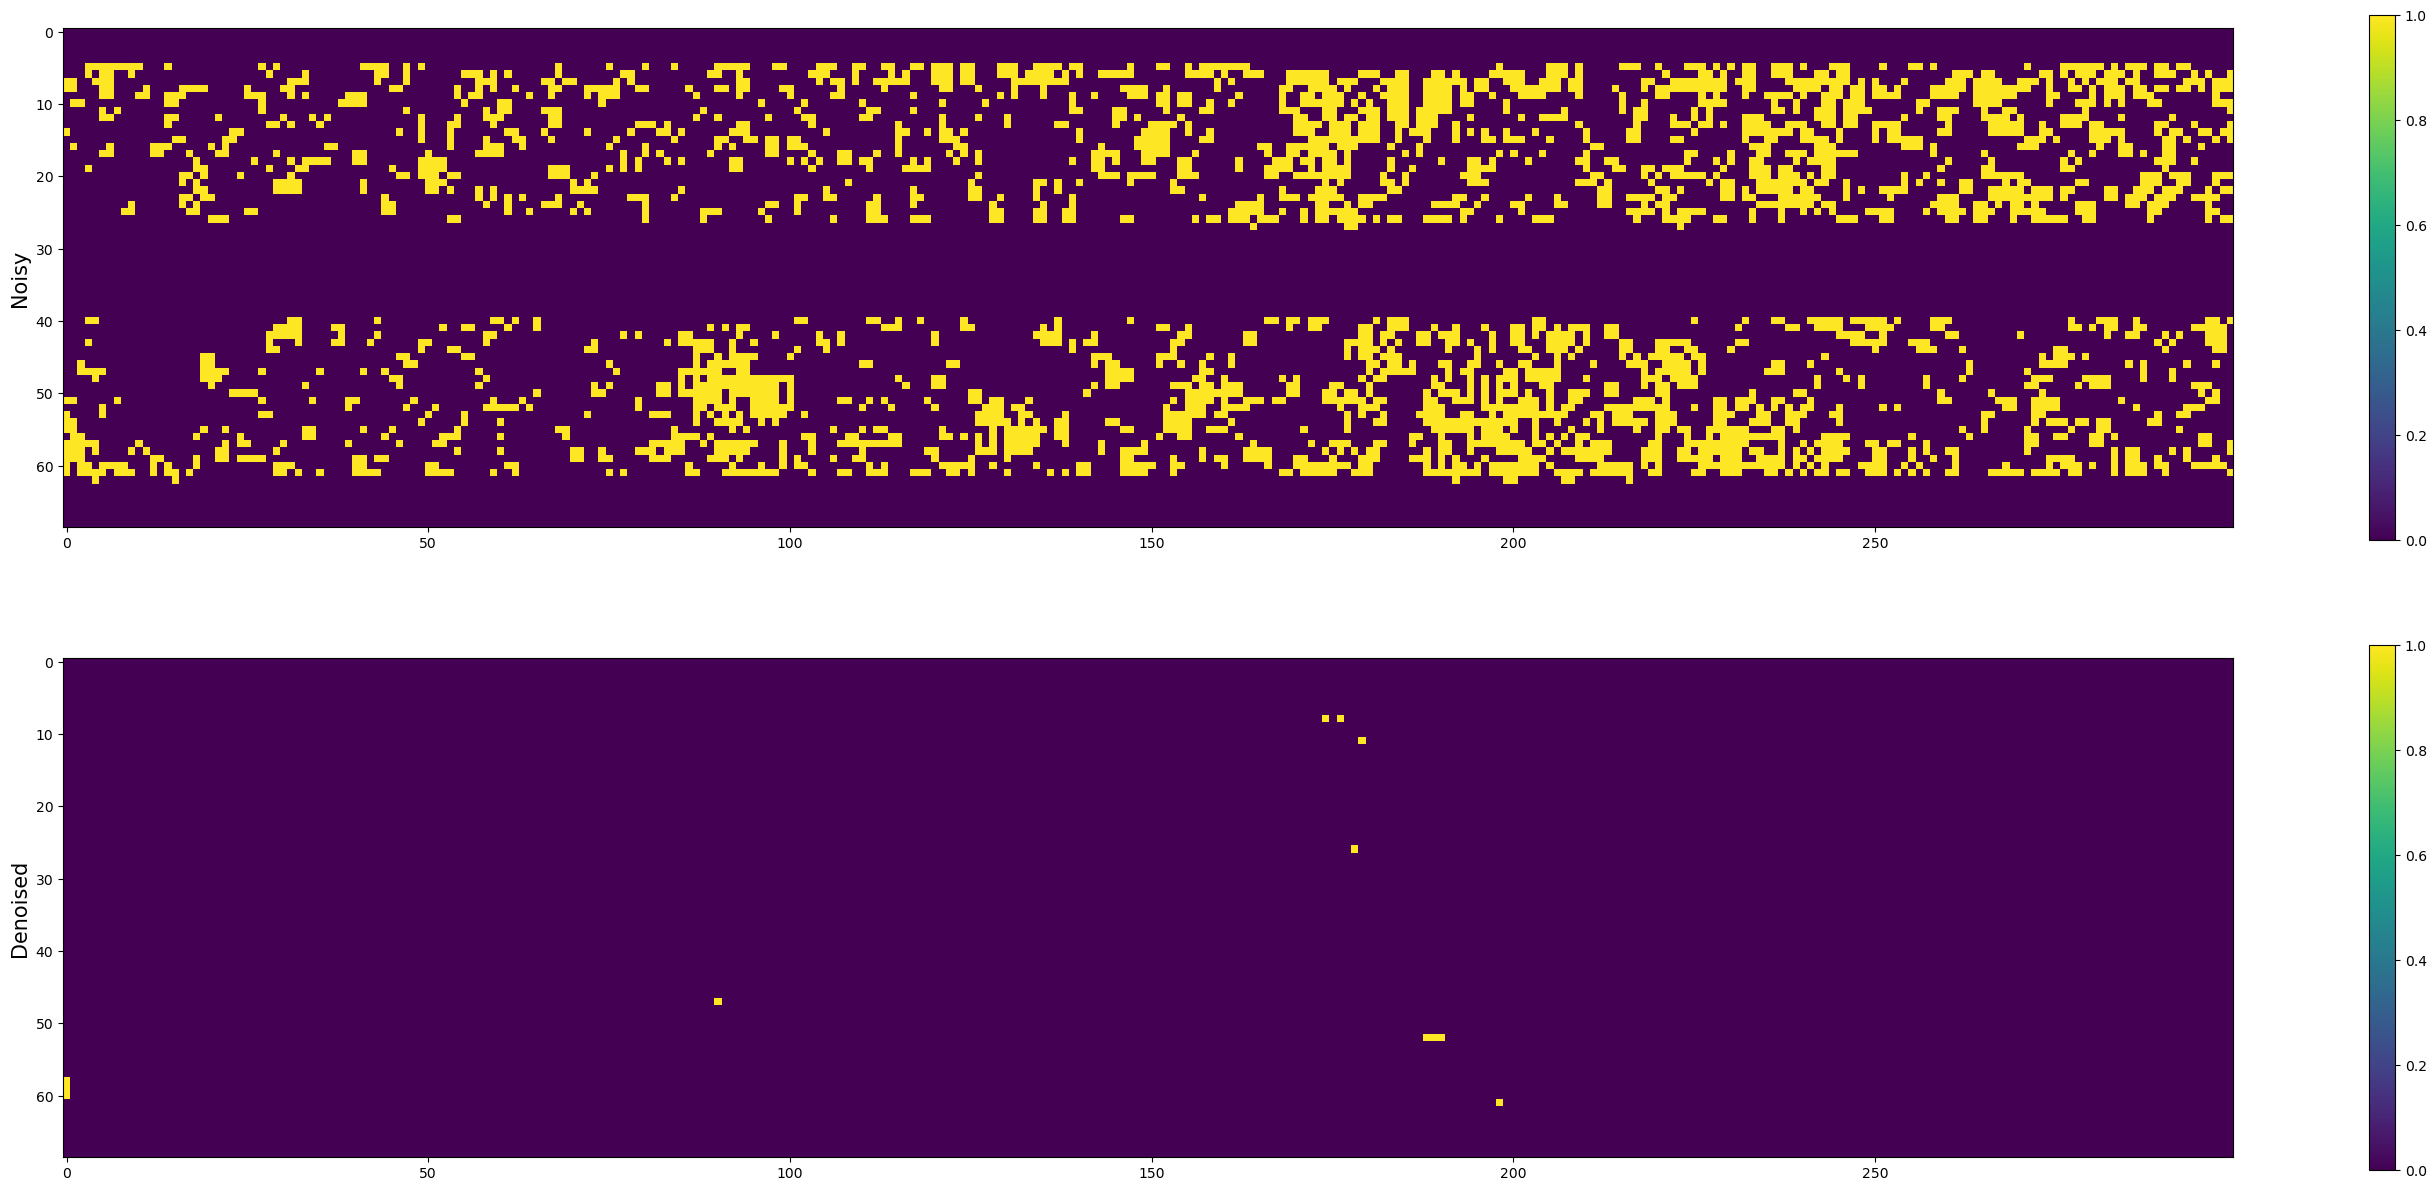
Total discontinuity percentages
Discontinuity scores based on the Roberts discontinuities. The scores correspond to the percentage of yellow points with respect to the blue points in the “Masked Roberts discontinuities” Figure above.
Noisy SWOT discontinuities: 24.43 %
Denoised SWOT discontinuities: 0.29 %
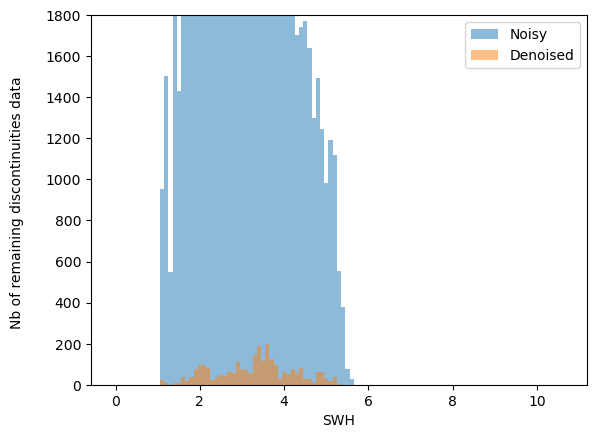
Discontinuities function of SWH |
|---|
|
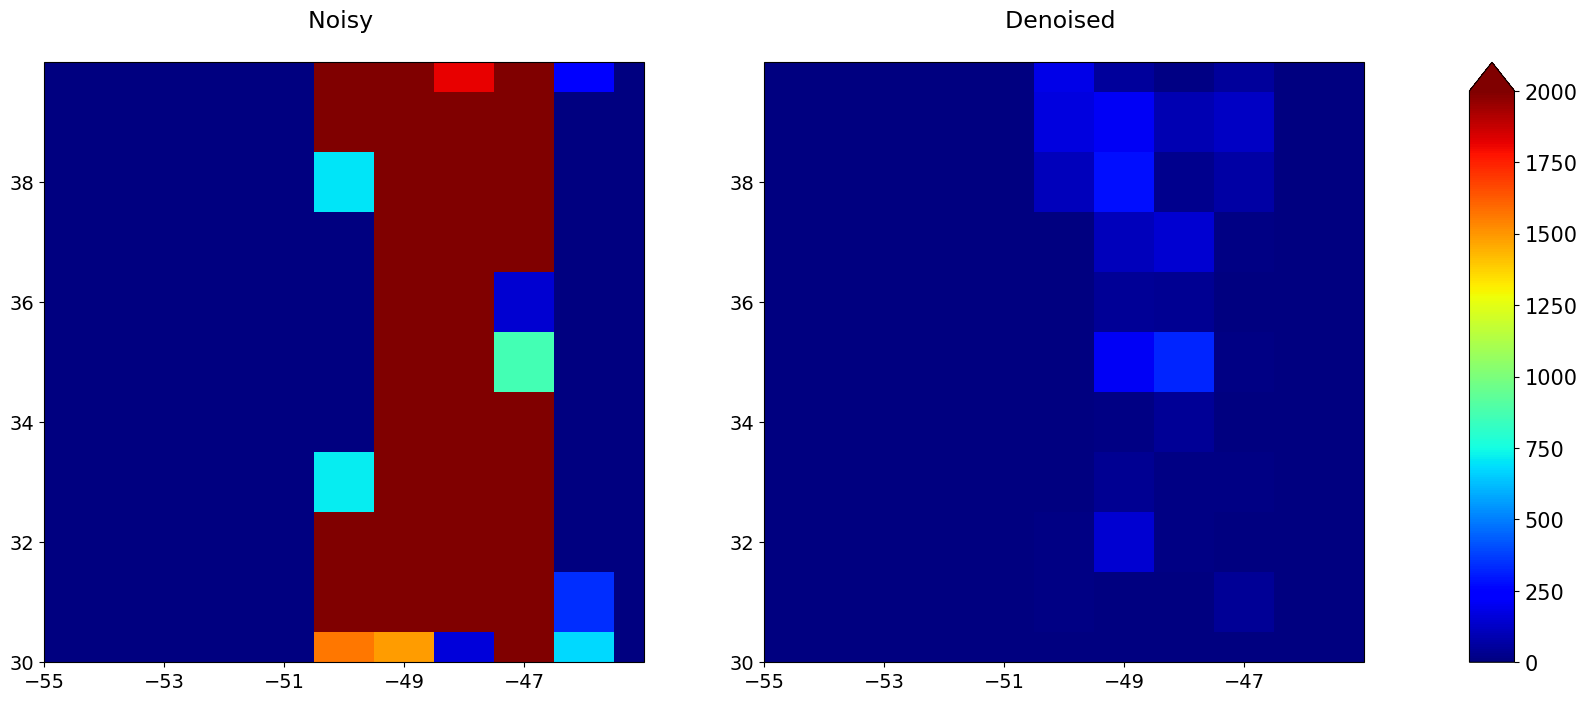
Discontinuities spatial distribution |
|---|
|
▶️ Structural similarities over 1 day repeat
On pass 20
SSHa |
|---|
|
Velocities |
|
Relative vorticity |
|
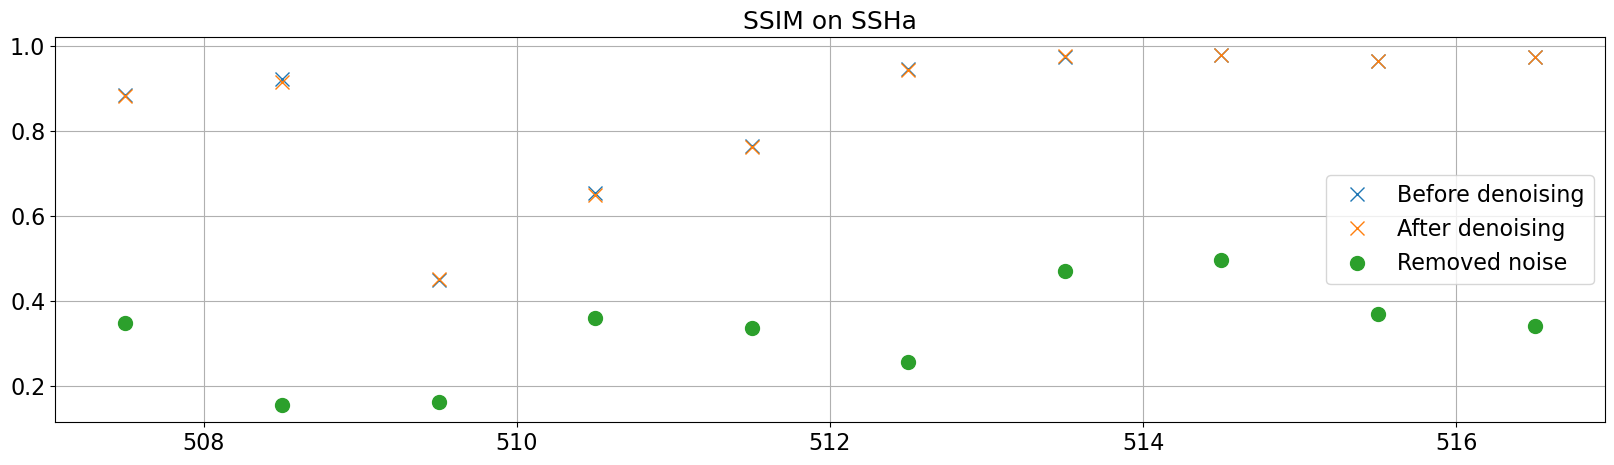
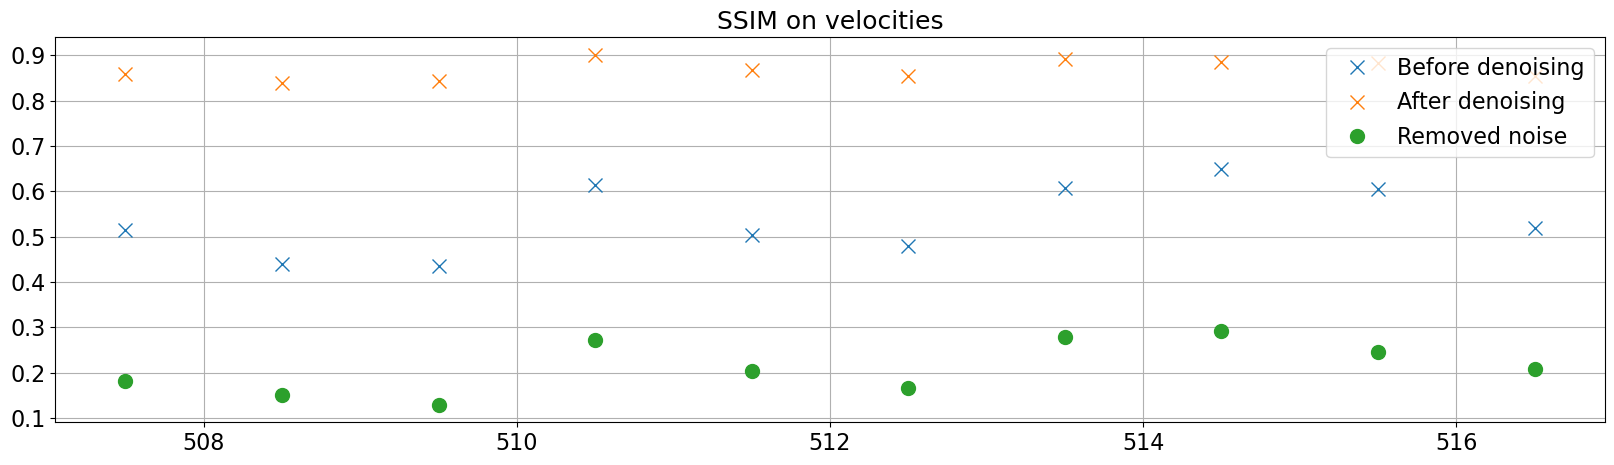
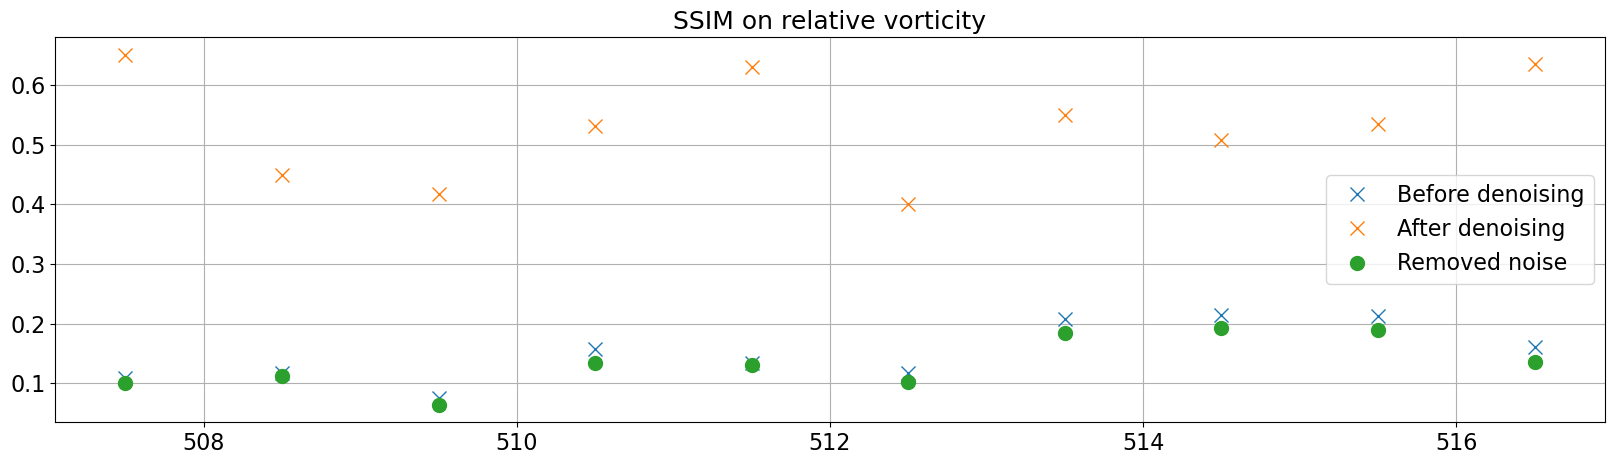
Average SSIM on SSHa
SSHa |
Velocities |
Relative vorticity |
|
|---|---|---|---|
Noisy SWOT |
0.852 |
0.537 |
0.150 |
Denoised SWOT |
0.851 |
0.868 |
0.531 |
Residual |
0.330 |
0.213 |
0.134 |